Session 2 - Data Literacy: Beyond the Basics

3. Visulising your Data
3.3. Filtering and Sorting
Sorting and Filtering Data in Spreadsheets
This section will guide you through the basics of sorting and filtering data in spreadsheets, specifically using Google Sheets and Microsoft Excel. These are fundamental skills for organizing and analyzing your data effectively.
Why Sort and Filter?
- Organization: Arrange your data in a logical order for easier understanding.
- Analysis: Focus on specific subsets of data to identify patterns and trends.
- Reporting: Extract relevant information for reports and presentations.
Sorting Data
- Concept: Sorting rearranges rows in your spreadsheet based on the values in one or more columns.
- Example: Sorting a list of student names alphabetically or arranging test scores from highest to lowest.
Steps to Sort
- Select the Data: Select the range of cells you want to sort. Include header rows if you have them.
Google Sheets:
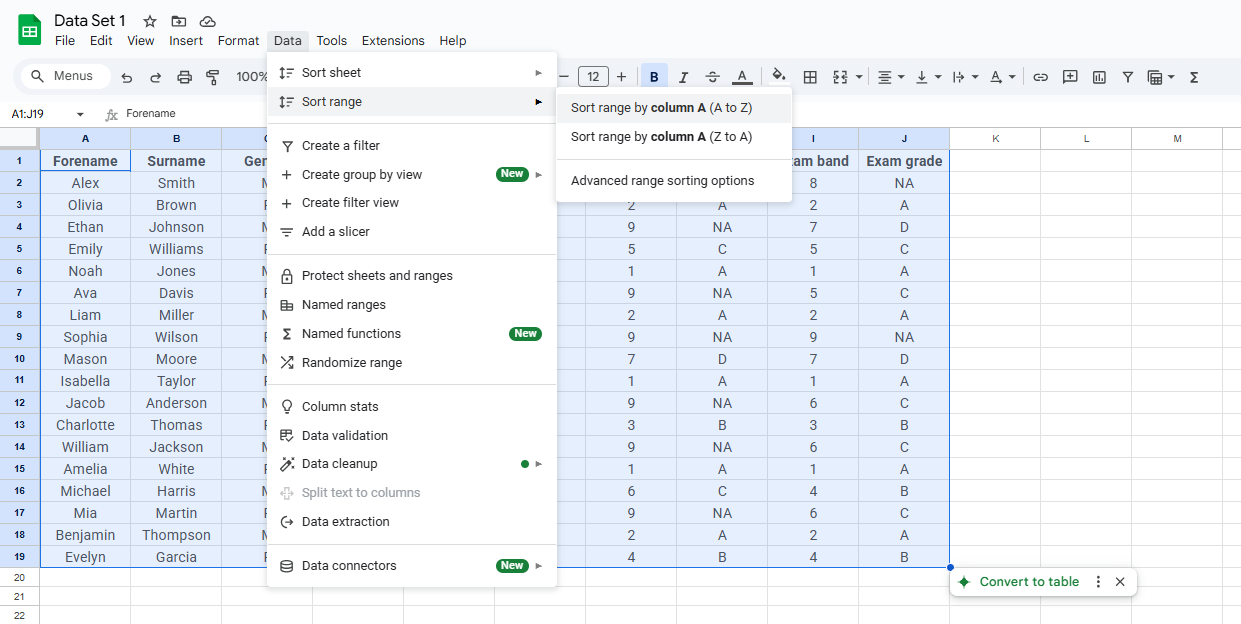
Go to "Data" > "Sort range" or right-click on a column letter and select "Sort sheet A to Z" or "Sort sheet Z to A". Choose the column to sort by and the sort order (ascending or descending).
Excel:
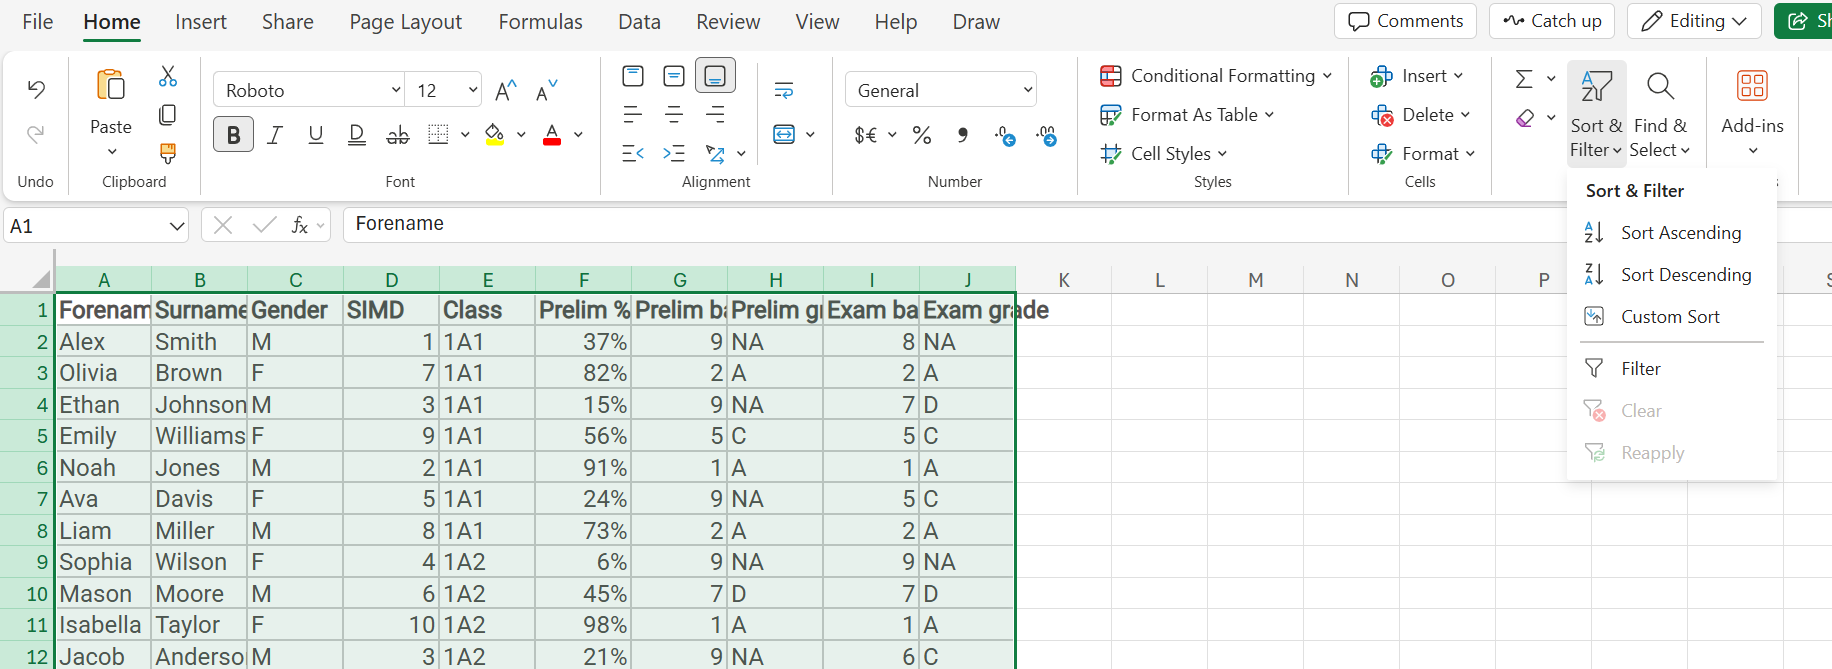
Use the "A to Z" or "Z to A" quick sort buttons. Alternatively, go to the "Data" tab and click "Sort". In the Sort dialogue box, specify the column to sort by and the sort order.
Filtering Data
- Concept: Filtering temporarily hides rows that don't meet specific criteria, allowing you to focus on a subset of your data.
- Example: Filtering a student list to show only students in a specific grade or those who scored above a certain mark.
Steps to Filter
- Apply Filter:
Google Sheets:
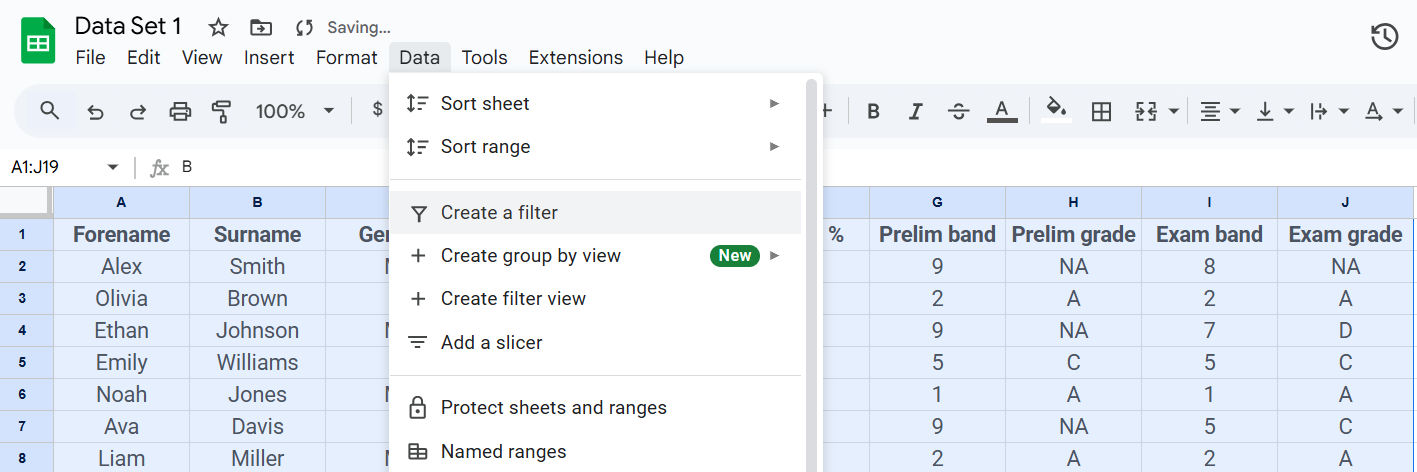
Select your data range, then go to "Data" > "Create a filter". Dropdown arrows will appear in the header row.
Excel:
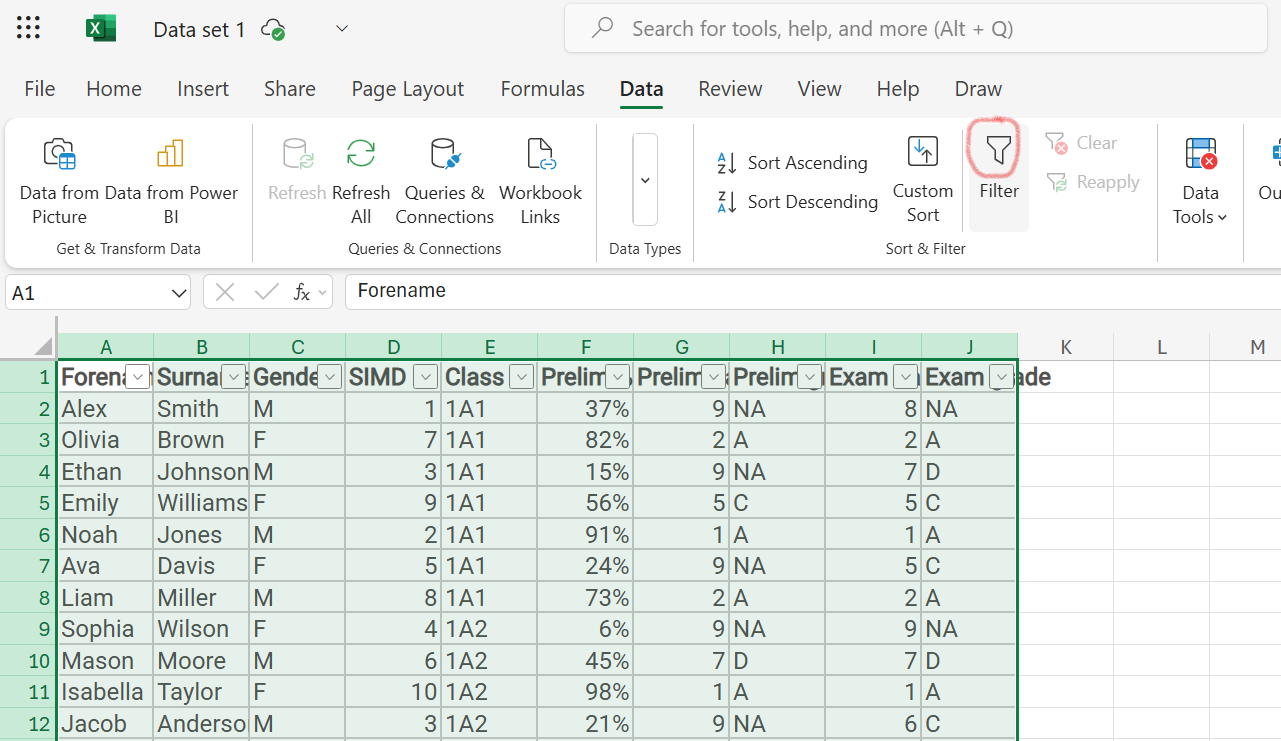
Select your data range, then go to the "Data" tab and click "Filter". Dropdown arrows will appear in the header row.
- Set Criteria: Click the dropdown arrow in the column you want to filter and select the criteria. You can choose specific values, use text or number filters, or create custom filters.
- Clear Filter: To remove the filter, in Google Sheets, click "Data" then "Remove filter". In Excel, click the filter button again.
Use Cases
- Student Performance Analysis: Filter student data to view only those who scored below a certain grade in a test. Sort by test scores to identify top and bottom performers.
- Attendance Tracking: Filter attendance data to identify students with a high number of absences. Sort by attendance percentage to identify trends.
- Behaviour Analysis: Filter behaviour incident reports to show only incidents of a specific type. Sort by date to analyze patterns over time.
- Identifying Students Needing Support: Filter student data to show only those with specific learning needs. Sort by assessment scores to prioritize support.
- Creating Class Lists: Filter student data to show only students in a specific class. Sort by last name to create an alphabetical class list.
Additional Tips
- Multiple Filters: Apply multiple filters to refine your results further.
- Clear Filters: Always clear filters when you're done to ensure you're viewing the complete dataset.
- Data Updates: If you change your data, remember that filters and sorts will reflect the current data.
Further Exploration
- Custom Filters: Explore advanced filtering options like custom formulas and conditional filters.
- Filter Views (Google Sheets): Use filter views to create multiple saved filter configurations.
- Slicers (Excel Tables): Use slicers for visually interactive filtering within Excel tables.