Session 3 - Data Driven Dialogue
| Site: | CLPL |
| Course: | Data Champions |
| Book: | Session 3 - Data Driven Dialogue |
| Printed by: | Guest user |
| Date: | Saturday, 5 September 2026, 12:29 AM |
Description

The Data Driven Dialogue
Welcome to the Data-Driven Dialogue!
In this section, we'll explore a powerful tool for using data to improve student learning: The Data-Driven Dialogue.

Imagine a detective meticulously examining clues to solve a mystery. Similarly, as educators, we use data to understand our students' learning journeys and identify areas where we can provide targeted support. The data-driven dialogue tool is like a roadmap for this investigation, guiding us through a structured process of analyzing data, discussing findings, and making informed decisions.
Why is the Data-Driven Dialogue Important?
- Informed Decisions: Data helps us understand where our students are, what they know, and where they need support. This allows us to tailor our instruction to their specific needs.
- Targeted Interventions: Instead of making assumptions, we can identify students who need extra help and provide them with the right support at the right time.
- Improved Student Outcomes: By using data to inform our teaching, we can create a more effective learning environment that leads to better student outcomes.
- Collaborative Growth: Data-driven dialogue fosters collaboration among educators. We can share insights, discuss challenges, and develop solutions together.
What will you learn in this section?
- The four key phases of the data-driven dialogue tool: Predictions, Observations, Inferences, and Next Steps?
- How to ask powerful questions about data.
- How to analyze data collaboratively and respectfully.
- How to translate data into actionable steps to improve teaching and learning.
- How to use data to drive continuous improvement in your practice.
Let's get started!
Click here to download a PDF template of the Data-Driven Dialogue
Click here to create your own copy of the data-driven dialogue in your Google Drive
Phase 1: Predictions
You should have identified the data you want to use with the data driven dialogue template. Have this ready to analyse as you work through each of the phases.
Before we even dive into the data, let's take a moment to activate our prior knowledge and surface any assumptions we might have. This step is crucial because our initial thoughts and beliefs can unintentionally influence how we interpret the data.
Think about what you expect to see in the data.
- What do you think you already know?
- Reflect and record your preliminary thoughts about the data you're about to review.
- For example, "I assume the data will show that most students are performing at their expected level."
- What do you predict the data will show?
- Make predictions based on your past experiences with this class, your knowledge of the subject matter, and any general trends you've observed.
- For example, "I predict the data will show that students are struggling with fractions."
- What are you curious to learn from the data?
- Pose questions about the data that you are eager to explore.
- For example, "I wonder if the data will show any patterns in student performance based on their learning style."
- What factors might be influencing your assumptions and predictions?
- Consider what past experiences, biases, or even personal beliefs might be shaping your expectations.
- For example, "My expectations are influenced by my past experiences with this grade level."
By explicitly acknowledging your initial thoughts and assumptions, you can approach the data with a more open and objective mindset in the next phase.
The audio clip will take you through Phase 1
Phase 2: Observations
Phase 2: Observations
Phase 2: Observations (15 minutes)
Now, it's time to shift our focus to the data itself. In this phase, we'll leave our predictions and assumptions aside and simply observe the data objectively.
Think of this as a detective meticulously examining a crime scene. We're looking for facts, figures, and patterns, without jumping to conclusions or making interpretations.
Key Tasks:
- Engage closely with the data: Spend time looking at the data carefully. Write directly on the data itself if possible to highlight key numbers, trends, or patterns.
- Focus on the facts: Record statements about quantities, specific information, and numerical relationships.
For example, "I observe that 20% of students scored below proficiency on the recent assessment."Or, "I can count that 15 students out of 25 answered question #3 incorrectly."
- Use descriptive language: Describe what you see in the data using precise and objective language.
For example, "There seems to be a correlation between students who participate in after-school tutoring and their performance on the final exam."
Remember, the goal of this phase is to gather information and understand the data on its own terms, without imposing any preconceived notions.
By carefully observing the data, we'll be better equipped to draw meaningful inferences and make informed decisions in the next phase.
Let's begin our observations!
Phase 3: Inferences
Phase 3: Inferences (10 minutes)
Now that we've carefully observed the data and identified key patterns and trends, it's time to move to the next level: making inferences.
In this phase, we'll go beyond simply describing the data and start to interpret its meaning. We'll generate multiple conjectures, explanations, conclusions, and inferences based on the observations we've made.
Now we get to ask why the data is showing us certain patterns and trends. We're piecing together the clues we've gathered to understand what the data is telling us about student learning and our teaching practices.
Key Tasks:
- What does the data suggest? Make inferences based on the patterns and trends you observed in the data.
- For example, "I believe the data suggests that students may benefit from additional instruction on fractions."
- What inferences can you draw from this information? Consider what the data might imply about student learning and your teaching practices.
- For example, "I infer that students may need more opportunities to practice applying fractions to real-world problems."
- What additional questions may need to be investigated? Identify any questions that arise from your analysis of the data.
- For example, "I wonder if students who struggle with fractions also struggle with other math concepts."
Be mindful to avoid making assumptions or jumping to conclusions. Instead, focus on generating multiple possible explanations and interpretations based on the evidence at hand.
Let's delve deeper into the meaning of the data!
Phase 4: Next Steps
Phase 4: Next Steps (10 minutes)
Now that we've analyzed the data, it's time to translate our insights into action. This phase is about planning your next steps and deciding how you'll use the data to improve student learning.
Think of this as the "action planning" phase. We're moving from data analysis to concrete strategies that will make a difference in the classroom.
Key Tasks:
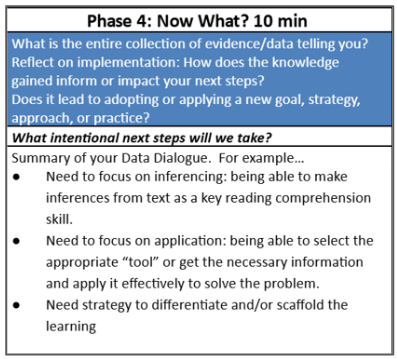
- Summarize your key findings: What is the overall message that the data is conveying?
- For example, "The data suggests that students need more support with fractions, particularly in applying them to real-world situations."
- What intentional next steps will we take? Identify specific actions you will take to address the learning needs revealed by the data.
- For example, "I will develop a small group intervention to provide targeted support to students who are struggling with fractions."
- How will these actions impact your teaching? Consider how your teaching will change as a result of your data analysis.
- For example, "I will incorporate more real-world examples into my math lessons to help students apply fractions to everyday situations."
This phase is about creating a concrete plan for using data to drive instructional improvement. By taking intentional next steps, we can ensure that our data analysis leads to meaningful and lasting changes in student learning.
Let's finalize our action plan and prepare to implement our strategies!