Session 1 - Introduction to Data
| Site: | CLPL |
| Course: | Data Champions |
| Book: | Session 1 - Introduction to Data |
| Printed by: | Guest user |
| Date: | Saturday, 5 September 2026, 12:53 AM |
Description
1. Introduction to Data
2. Understanding Data and Its Importance
Think about the data you have access to in your teaching role.
- What types of data do you regularly collect or have access to? (e.g., assessment results, attendance records, behavior data, student feedback)
- How do you currently use this data to inform your teaching? (e.g., to identify gaps in learning, track student progress, make decisions)
- Are there any ways you could use data more effectively or efficiently? (e.g., by using data analysis tools, collaborating with colleagues, or seeking professional development)
Take a few minutes to reflect on these questions and jot down your thoughts in your notes.
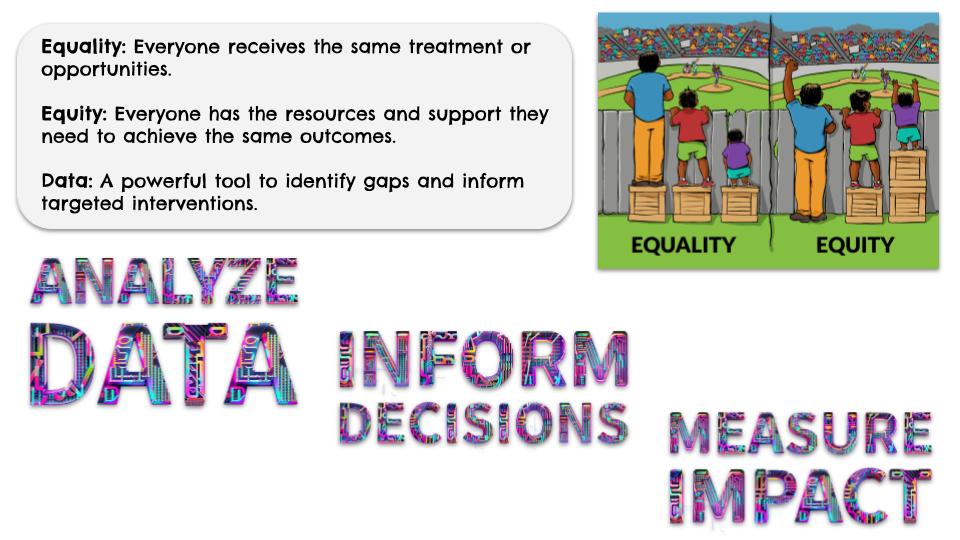
3. Equality, Equity and Poverty
Questions for Reflection:
- How do you think the concepts of equality and equity differ in the context of education?
- What are some of the challenges that students facing poverty may encounter in school?
- How can data be used to identify and address inequities in education?
- What role can teachers play in creating a more equitable learning environment?
3.1. Poverty: setting the scene
Self-Led Research Task: Child Poverty in the UK - A Deep Dive
This research task delves deeper into the 2024 child poverty statistics from the End Child Poverty Coalition website (https://data.gov.scot/poverty/cpupdate.html). Download the Data Tables for local authority figures.
Task:
Analyze the statistics presented by the End Child Poverty Coalition on child poverty in the UK for 2022/23. Based on your findings, address the following questions:
-
Prevalence: According to the report, what is the current rate of child poverty in the UK? How does this translate to the number of children living in poverty?
-
Trend Analysis: Analyze the child poverty rates for your local authority over the past few years. Are they increasing, decreasing, or remaining relatively stable?
-
Local Landscape: Compare the child poverty rates in your local authority to those in another local authority within Scotland. Are there significant differences or similarities?
4. Types of Data
Reflect on the data you listed in Section 2. How would you classify each piece of data? Consider factors like whether it's descriptive or numerical, and if it relates to the learners, the learning environment, or the learning outcomes.
Using Different Types of Data
Triangulation of Data
HGIOS 4 emphasizes the importance of data triangulation, a technique where multiple data sources and methods are employed to gain a deeper and more reliable understanding of educational phenomena. Triangulation, drawing from qualitative research principles (Patton, 1999), aims to validate findings by seeking convergence across diverse data points. For example, combining student performance data with teacher interviews and classroom observations provides a multifaceted view, reducing the risk of single-source bias and enhancing the overall validity of the evaluation.
5. Find some Data
Select Your Data for Session 2. To fully benefit from Session 2's data visualization and analysis techniques, please complete the following before the session:
- Identify a Relevant Dataset: Think about the data you routinely use or need to understand better. This could include:
- Student attainment data
- Attendance rates
- Behavioral incident reports
- Parent/student survey responses
- Any other data relevant to your setting.
- Gather the Data: Ensure you have access to the chosen dataset in a format you can work with (e.g., spreadsheet, database export).
- Prepare for Hands-On Learning: We'll provide example datasets, but using your own will enable you to immediately practice and apply the skills learned in Session 2 to your specific needs and challenges.